Main
Module (A-01)
A.
Plotting Intersection and Mid-Block Accidents In 3 Dimensions On GIS Map:
·
It plots accidents on GIS map corresponding to the locations
where accidents occurred. Mid-block accidents are plotted according to their relative
distances or mileposts.
·
Each symbol denotes an accident. Red circles denote
intersection accidents. Blue squares denote mid-block accidents. If the
accidents occurred at the same location, the symbols are stacked on top of one
another, creating a three-dimensional view.
·
It is easy to detect high accident locations, because they
have higher stack of symbols.
·
You can select accidents to be plotted by drawing any
combinations of circles, rectangles and polygons on the map, AIMS will retrieve
all accidents corresponding to the specified areas and will plot them out with
3-dimensional symbols as shown in Figure A-01A below.
·
You can select accidents to be plotted through query. You
can query any fields in your data; AIMS will retrieve all accidents corresponding
to the query and will plot them out with 3-dimensional symbols as shown in
Figure A-01A below.
·
You can specify different size, shape and color of symbols.
·
You can click a plotted symbol to see the detail accident
record, because each symbol is linked to its accident record (see Figure
A-01D).
·
You can add texts, lines and other drawings to the plot, and
save the plot in word processor and spreadsheet programs for report purposes.
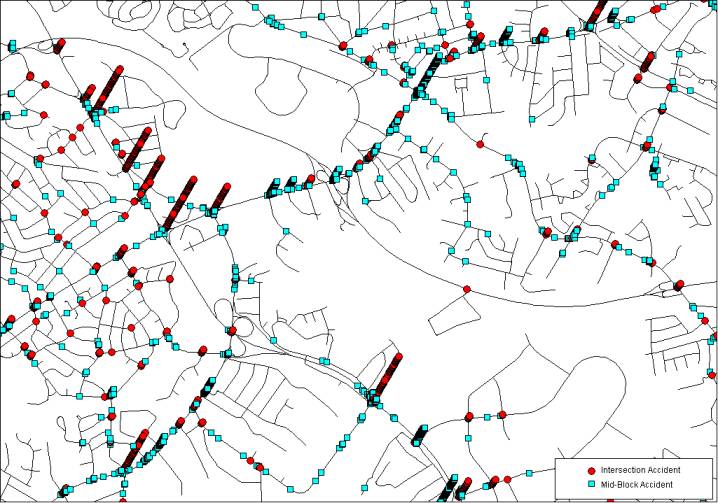
Figure A-01A: Plotting Intersection and Mid-Block Accidents
in 3 Dimensions On GIS Map
B.
Plotting Collision Types In 3 Dimensions On GIS Map:
·
In additional to the 3 dimensions plotting features as
described in previous page, you can plot different collision types in 3
dimensions on GIS map, as shown Figure A-01B below.
·
You can use different shapes, colors, and sizes of symbols
to denote different types of collisions. For example, circles for intersection
collisions, squares for mid-block collisions, yellow for rear end collisions,
blue for left turn collisions, and so on.
·
You can label each plotted symbol with information from 1 to
10 fields in the accident record. For example, you can label each symbol with
year, injury, fatality, and pedestrian, as shown in Figure A-01C.
·
You can assign a height factor to adjust the distance
between each stacked symbol.
·
You can adjust the angle of stacked symbols (90 degree to
stack vertically upward, 0 degree to stack horizontally).
·
If you order the Aerial Photograph Module (Item A-08), the
collision types in 3 dimensions can be plotted on aerial photograph (see Figure
A-08)
·
If you order the Accident Report Image Module (Item A-11),
when you click a plotted symbol, it will display the scanned accident report
image on the screen (see Figure A-11B).
Figure A-01B: Plotting Collision Types in 3 Dimensions On
GIS Map
C. Labeling Each Plotted Symbol
With Information From 1 To 10 Fields
·
You can choose font size, type and color.
·
You can set up meaningful expressions. For example, if the
expression is “Yr=” + Field1_value + “, Inj#=” + Field2_value + “, Kill#=” +
Field3_value + “, Ped#=” + Field4_value, then the label will look like A-01C as
shown below.
·
You can adjust the size, distance and stack angle of the
symbols.
·
The label will be clear and sharp in zoom-in view because
the plot is in vector format.
Figure A-01C: Labeling Each Plotted Symbol With Information
From 1 to 10 Fields, Such As Year, Injury, Fatality and Pedestrian
D. Displaying Detail Record Information Associated With
Each Plotted Symbol
·
You can adjust the size, distance and stack angle of the
symbols.
·
You can zoom-in to pick the desired symbol for displaying
its detail record information.
Figure A-01D: Displaying Detail Record Information
Associated With Each Plotted Symbol (After Clicking A Symbol)
E. Summary of Features of Main Module (A-01)
Computer Requirements:
Hardware: Computer with 1GB or more RAM, 100 GB or more hard disk space.
Software:
Windowsâ (10 or 11)
and a GIS map of your jurisdiction.
GIS Platforms:
·
AIMS interfaces with ArcGIS 9X or later and MapInfo
Professional 8X or later.
·
It can use data and map from ArcGIS, MapInfo,
Geomedia, TIGER, etc.
Intersection & Non-intersection
Accidents:
·
You can analyze intersection and
non-intersection (mid-block) accidents.
3-Dimensional Plots:
Plotting
Intersection and Mid-Block Accidents In 3 Dimensions On GIS Map:
·
It plots accidents on GIS map corresponding to the locations
where accidents occurred. Mid-block accidents are plotted according to their
relative distances or mileposts.
·
Each symbol denotes an accident. Red circles denote
intersection accidents. Blue squares denote mid-block accidents. If the
accidents occurred at the same location, the symbols are stacked on top of one
another, creating a three-dimensional view.
·
It is easy to detect high accident locations, because they
have higher stack of symbols.
·
You can select accidents to be plotted by drawing any
combinations of circles, rectangles and polygons on the map, AIMS will retrieve
all accidents corresponding to the specified areas and will plot them out with
3-dimensional symbols as shown in Figure A-01A.
·
You can select accidents to be plotted through query. You
can query any fields; AIMS will retrieve all accidents according to the query
and will plot them out with 3-dimensional symbols as shown in Figure A-01A.
·
You can specify different size, shape and color of symbols.
·
You can click a plotted symbol to see the detail accident
record, because each symbol is linked to its accident record (see Figure
A-01D).
·
You can add texts, lines and other drawings to the plot, and
save the plot in word processor and spreadsheet programs for report purposes.
Plotting
Collision Types In 3 Dimensions On GIS Map:
·
You can plot different collision types in 3 dimensions on
GIS map as shown in Figure A-01B.
·
You can use different shapes, colors, and sizes of symbols
to denote different types of collisions.
·
You can label each plotted symbol with information from 1 to
10 fields in the accident record. For example, you can label each symbol with
year, injury, fatality, and pedestrian, as shown in Figure A-01C.
·
You can assign a height factor to adjust the distance
between each stacked symbol.
·
You can adjust the angle of stacked symbols (90 degree to
stack vertically upward, 0 degree to stack horizontally).
·
If you order the Aerial Photograph Module (Item A-08), the
collision types in 3 dimensions can be plotted on aerial photograph (see Figure
A-08)
·
If you order the Accident Report Image Module (Item A-11),
when you click a plotted symbol, it will display the scanned accident report
image on the screen (see Figure A-11B).
Query Capabilities:
·
You can perform unlimited number of queries,
using combinations of 21 operators and 40 functions.
·
Operators include =, <>, >, <,
>=, <=, +, -, *, /, ^, And, Or, Not, Like, Contains, Intersect, within,
etc.
·
Functions include Avg, Count, Min, Max, Sum,
Area, CentroidX, CentroidY, Chr$, Cos, CurDate, Day, Distance, Format$, Int,
Left$, Len, LTrim$, Month, Perimeter, Round, Sin, Str$, Val, Year, etc.
·
You can save query expressions and re-use them
again. You can query on previously queried results.
Graph Capabilities:
·
You can display results in bar, line, pie, area
and/or x-y graphs.
Pin Map or Plot Generation Capabilities:
It produces a plot or pin map for the accident
locations you clicked on map. It also produces a plot or pin map from your
query or sorting. Hence it can produce unlimited number of user-specified pin
maps or plots.
In addition, it produces over 10 standard reports. Standard plots are
pre-programmed pin maps, user simply clicks a button, and the plot will automatically
be generated. The standard plots include:
·
A pin map showing all
accident locations within the whole jurisdiction.
·
A pin map of the worst 100
accident locations.
·
A pin map of all locations
with red-light violation accidents.
·
A pin map of all locations
with drunk-driving accidents.
·
A pin map of all locations
with speeding accidents.
The above pin maps use 3-dimensional symbols as described under
3-Dimensional Plots. That is, locations with higher accidents will have higher
stacks of symbols. You can visualize where are the hot spots. As new data are
entered, these reports and plots will be updated to reflect the status.
Report Generation Capabilities:
As mentioned under Query Capabilities, you can
perform unlimited number of queries. Each query result is a report. Hence you
can generate unlimited number of reports to meet your needs.
In addition, it produces over 30 standard reports. Standard reports are
pre-programmed reports, user simply clicks a button, and the report will
automatically be generated. The standard reports include:
·
Number of accidents for
every location within the jurisdiction.
·
Worst 100 accident
locations, arranged in descending order.
·
Locations with red-light
violation accidents.
·
Locations with drunk
driving accidents.
·
Locations with speeding
accidents.
·
Number of injuries by
locations.
·
Number of fatalities by
locations.
·
Number of accidents by
accident type.
·
Number of accidents by
accident cause.
·
Number of accidents by day
of week.
·
Yearly summary, including
number of accidents, number of injury accidents, number of fatal accident,
number of persons injured, number of persons killed, etc, per year.
·
List all accident records.
Data Source and Maintenance:
·
We customize AIMS to adapt to your data so that
you rarely need to change your data structure, format or coding definition.
Your accident data may be from any database or GIS system.
·
You can add, delete or modify data using AIMS
“Update” module.
·
New data can be saved as a file in ASCII (text),
dBASEâ,
Accessâ,
Excelâ
format. AIMS will read the file, geocode the data and incorporate them into the
system.
Adding Texts, Symbols & Drawings:
·
You can add texts, symbols and drawings (line,
polyline, circle, ellipse, rectangle, polygon, etc.) to the map, plot or
collision diagram. You can specify color, size & style of texts, symbols
and drawings.
Printing & Saving Outputs:
·
You can send AIMS’s output to printer or
plotter.
·
AIMS output can be saved as a file in ASCII (or
TXT), BMP, DAT, DBF, DXF, IND, JPEG, JPG, MAP, MIF, PNG, PSD, SHP, SHX, TAB,
TIF, or WMF format.
Size & Format of Accident Data:
·
It handles up to 1 million records, and up to
255 fields per record.
·
AIMS accepts files in ASCII (text), dBASEâ, Accessâ, Excelâ format.